





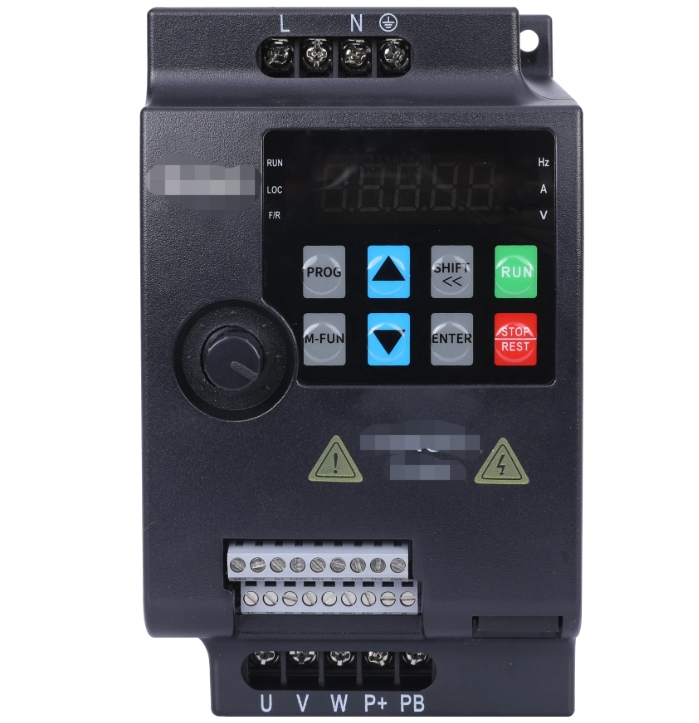
Abnormal current signals from variable frequency drives are a common fault in the field of industrial automation; their causes are complex and can trigger a chain reaction of equipment problems. When current signals fluctuate, become distorted, or exceed limits, a systematic analysis must be conducted from four perspectives: hardware circuits, parameter settings, load characteristics, and environmental interference.
I. Typical Symptoms of Hardware Circuit Failures
1. Current Sensor Failure
Saturation of the Hall sensor's magnetic core or zero-point drift can cause measured values to deviate from actual values. For example, in a case at a chemical plant, the variable-frequency drive continuously reported an "output overcurrent" fault; it was eventually discovered that aging internal insulation in the sensor had caused a measurement error of ±10%. In such cases, calibration with a standard current source is required, or the sensor must be replaced with a new model featuring temperature compensation.
2. IGBT Module Degradation
Deterioration in the switching characteristics of power devices causes current waveform distortion. An infrared thermal imager can reveal uneven temperature distribution across the module's surface, accompanied by an increase in harmonic components at the switching frequency. Data from a wind power converter showed that when the module's on-state voltage drop exceeded 1.5 times its initial value, the three-phase current imbalance could reach over 8%.
3. Decline in Bus Capacitor Capacity
An increase in the ESR (equivalent series resistance) of DC bus electrolytic capacitors leads to exacerbated high-frequency ripple current. Field measurements indicate that a capacitor bank with a 30% reduction in capacity causes the current THD (total harmonic distortion) to rise from 5% to 12%, a phenomenon particularly pronounced during operation in the low-frequency range (<50 Hz).
II. Hidden Effects of Improper Parameter Settings
1. Carrier Frequency and Load Resonance
When the PWM carrier frequency approaches the natural frequency of a mechanical system, it may excite resonant currents. In a case study involving a machine tool spindle drive, adjusting the carrier frequency from 8 kHz to 12 kHz reduced current fluctuations from ±15% to ±3%. It is recommended to identify resonance points through FFT analysis.
2. Incorrect V/f Curve Matching
Selecting a square-law torque-reduction curve for a constant-torque load can result in excessively high excitation current during light-load conditions. Measurement data from a water pump retrofit project showed that an optimized V/f curve reduced operating current by 22% while improving the power factor to 0.93.
3. Current-Loop PID Parameter Misalignment
Excessive proportional gain may cause current oscillations, while an excessively long integral time can lead to sluggish dynamic response. It is recommended to use the step response method for tuning: first set the integral time to infinity, gradually increase the proportional gain to the critical oscillation point, and then set 60% of that value as the stable setting.
III. Characteristic Identification of Load-Side Anomalies
1. Motor Insulation Defects
A turn-to-turn short circuit in the windings can produce a surge of 5–7 times the rated current. Polarization index (PI) testing is an effective diagnostic method: if the 10-minute-to-1-minute insulation resistance ratio is less than 2, it indicates that the insulation has deteriorated. Records from a steel rolling mill motor prior to failure showed that the PI value dropped from 3.8 to 1.2 in just three months.
2. Mechanical Drive Jamming
Bearing damage or abnormal gear meshing can cause periodic current fluctuations. Envelope demodulation analysis can extract characteristic fault frequencies; for example, when a conveyor belt gearbox failed, a 23.5 Hz sideband component (corresponding to the gear defect frequency) was clearly visible in the current signal.
3. Cable Distributed Capacitance Effects
During long-distance power transmission, the capacitance of the cable to ground may cause high-frequency oscillations. Empirical formulas indicate that when the cable length exceeds 100 meters and the carrier frequency is greater than 6 kHz, an output reactor must be installed. In a case study involving a mine hoist, installing a du/dt filter reduced current spikes from 180% to 110%.
IV. Strategies for Suppressing Electromagnetic Interference
1. Common-Mode Interference Paths
When a variable-frequency drive and a PLC share a common ground, ground loops may interfere with current sampling. It is recommended to use optically isolated analog signal transmission or double-shielded cables (with the inner shield connected to signal ground and the outer shield connected to chassis ground). Test data shows that this measure can reduce interference voltage by more than 40 dB.
2. Spurious Radiated Interference
Radio-frequency noise generated by high-power inverters may affect sensor operation. Field tests on an automotive production line revealed that the magnetic field strength at a distance of 30 cm from the inverter reached 85 dBμA/m; after installing ferrite chokes, the sensor's bit error rate decreased by 98%.
3. Power Supply Harmonic Backfeed
5th and 7th harmonics from the utility grid may affect the output via the rectifier bridge. When the input current THD exceeds 8%, it is recommended to install a 12-pulse rectifier or an active front end. After retrofitting, a semiconductor factory reduced its output current distortion rate from 9.3% to 3.1%.
V. Recommendations for Standardizing the Diagnostic Process
1. Three-Level Inspection Method
● Primary: Inspect cable joints for oxidation and check tightening torque (recommended values per IEC 60079-14).
● Intermediate: Use a true RMS clamp meter to compare three-phase current deviations (warning threshold > 5%).
● Advanced: Capture current waveforms using an oscilloscope to analyze ringing phenomena on the rising edge.
2. Fault Tree Analysis
Establish a fault tree with "current anomaly" as the top event, covering 22 root causes (such as cooling fan stoppage, encoder signal loss, etc.), and calculate the posterior probabilities of each factor using a Bayesian network.
3. Implementation of Predictive Maintenance
Deploy an online monitoring system to track the current kurtosis metric. An early warning is triggered when this value exceeds the 2σ baseline for 3 consecutive hours. A case study at a cement plant demonstrates that this method can predict bearing failures 72 hours in advance.
Current-generation SiC inverters have begun to integrate self-diagnostic functions for current waveforms, using neural network algorithms to identify 14 typical anomaly patterns. However, traditional equipment still relies on engineers' experience-based judgments. It is recommended to establish an enterprise-level fault case database to transform tacit knowledge into standardized response procedures.